
Species Similarity and Clustering
Once species have been fitted and classified, the resulting parameter sets and observed seasonal characteristics can be converted into a common ecological feature space that allows species from different model families to be compared using a shared representation of seasonal ecological structure.
The workflow is illustrated, below:
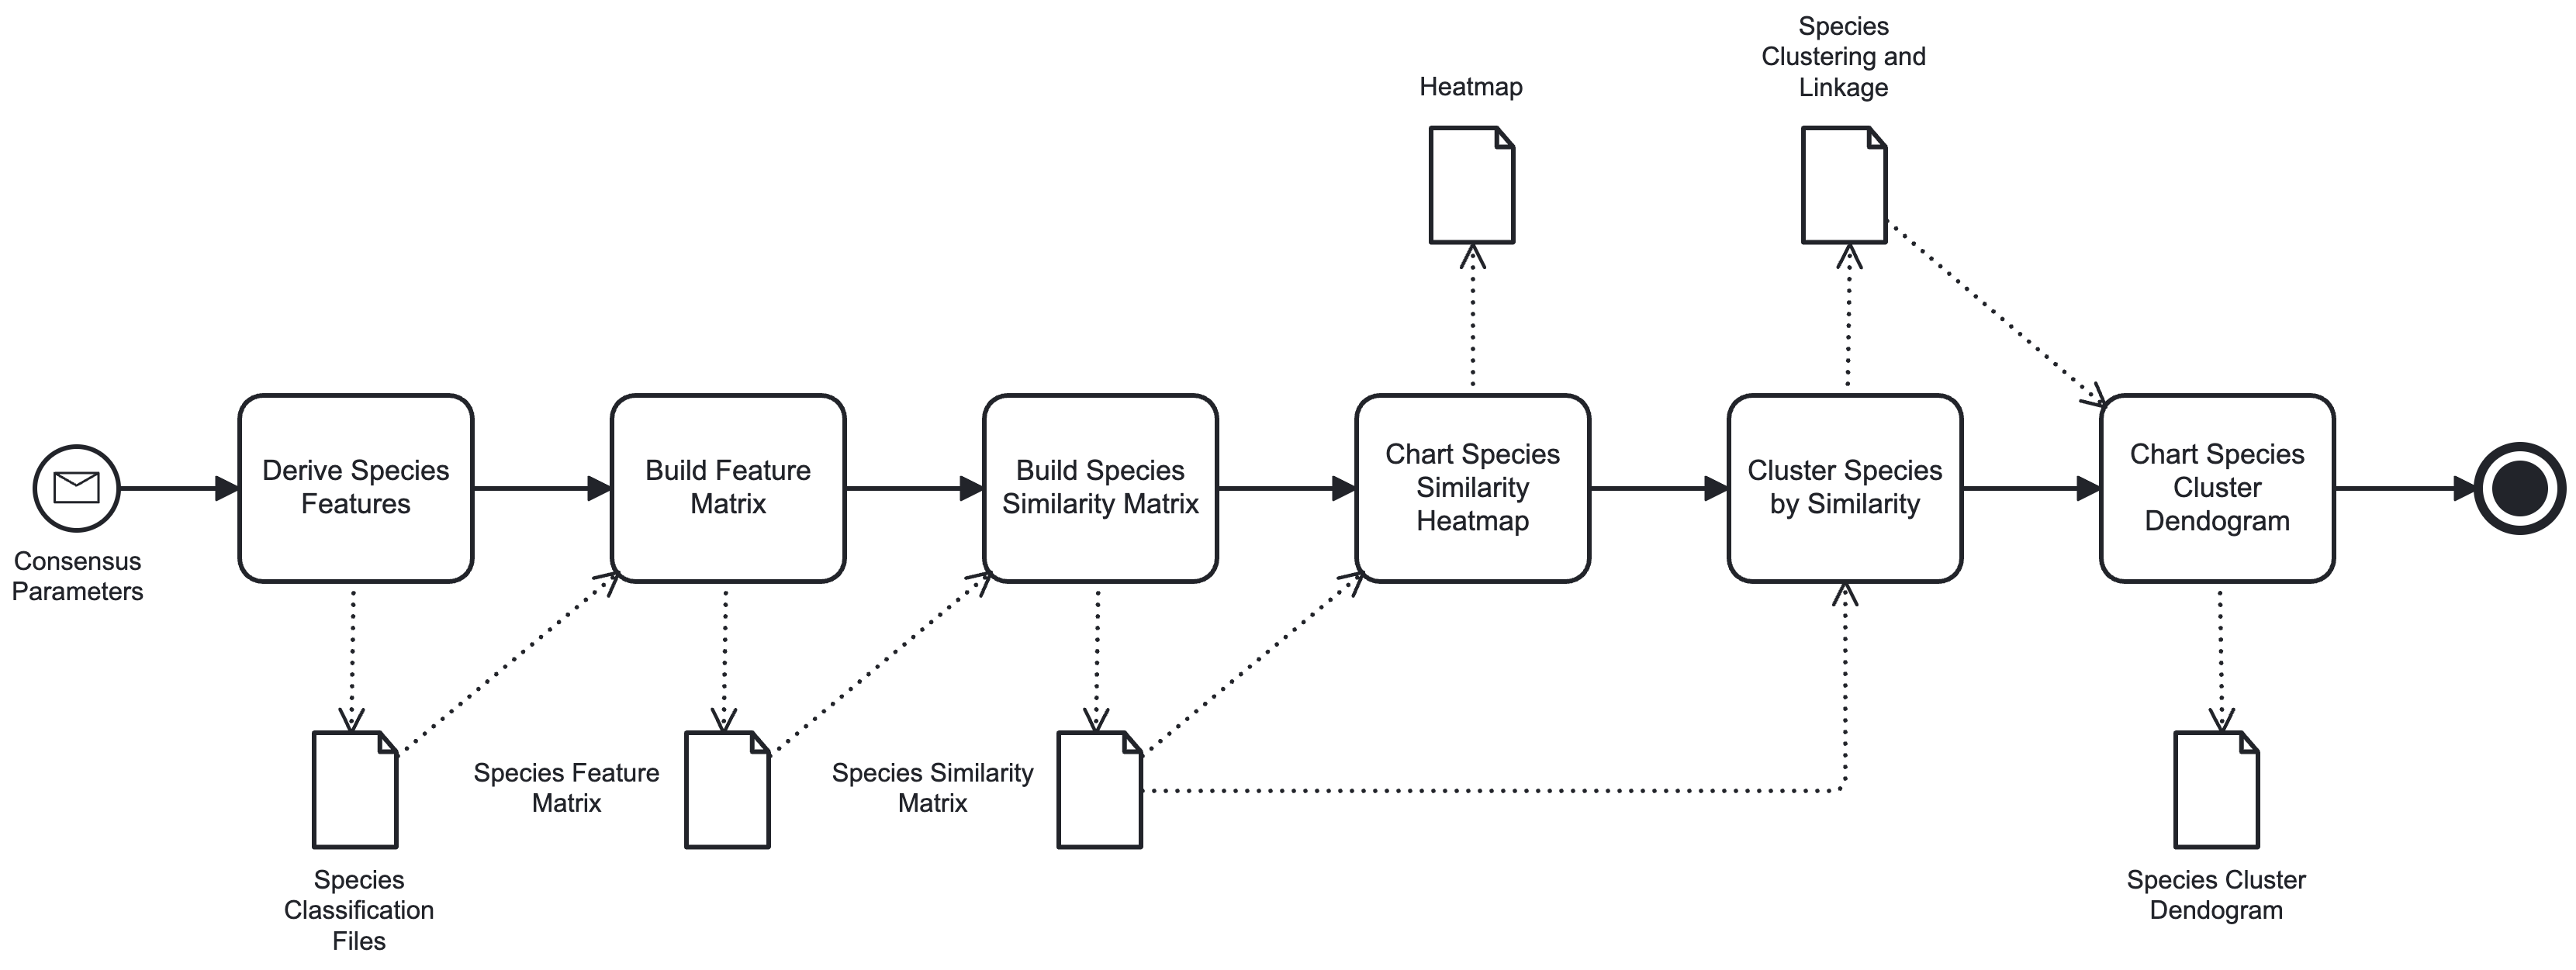
The classifications for individual species are collated to create a feature matrix that is analysed to produce a similarity matrix, comparing species using weighted ecological similarity metrics.
The aim is not to identify taxonomic similarity, but similarity of seasonal ecological signal:
- Shared timing structure
- Similar persistence behaviour
- Overlapping flowering or migration periods
- Comparable detectability dynamics
- Broad phenological synchrony
This allows relationships to emerge not only within groups, but also across the ecosystem as a whole. Butterfly flight periods, flowering seasons, migratory arrival windows, and resident detectability patterns may all align within the same seasonal structure.
In this sense, the system becomes less a species comparison tool and more an exploration of the seasonal organisation of ecological activity.
Tool
ODE Solver
A simple tool for exploring time-based models
The seasonal presence and detectability models were developed using a small, general-purpose ordinary differential equation solver, designed for experimentation and visualisation.
It allows simple systems to be defined and explored over time, making it possible to test how patterns might arise from underlying processes.
The application, the models, and instructions on how to run them are provided in the GitHub repository.