
Ecological Neighbourhoods
Once pairwise similarities have been calculated, the resulting structures can be explored using clustering, dendrograms, and similarity heatmaps.
Rather than grouping species taxonomically, these approaches group species according to similarity of seasonal ecological structure. Species occupying nearby regions of seasonal ecological space form what may be thought of as ecological neighbourhoods — groups sharing broadly similar timing, persistence, detectability dynamics, or seasonal occupancy patterns.
The workflow therefore doesn’t ask:
Which species are biologically related?
but, rather:
Which species occupy similar positions within the ecological year?
This allows relationships to emerge across very different groups of organisms. Flowering plants, migratory birds, butterflies, and resident species may all cluster together if their seasonal ecological behaviour follows similar temporal structure.
The resulting similarity matrix can be visualised as a heatmap:
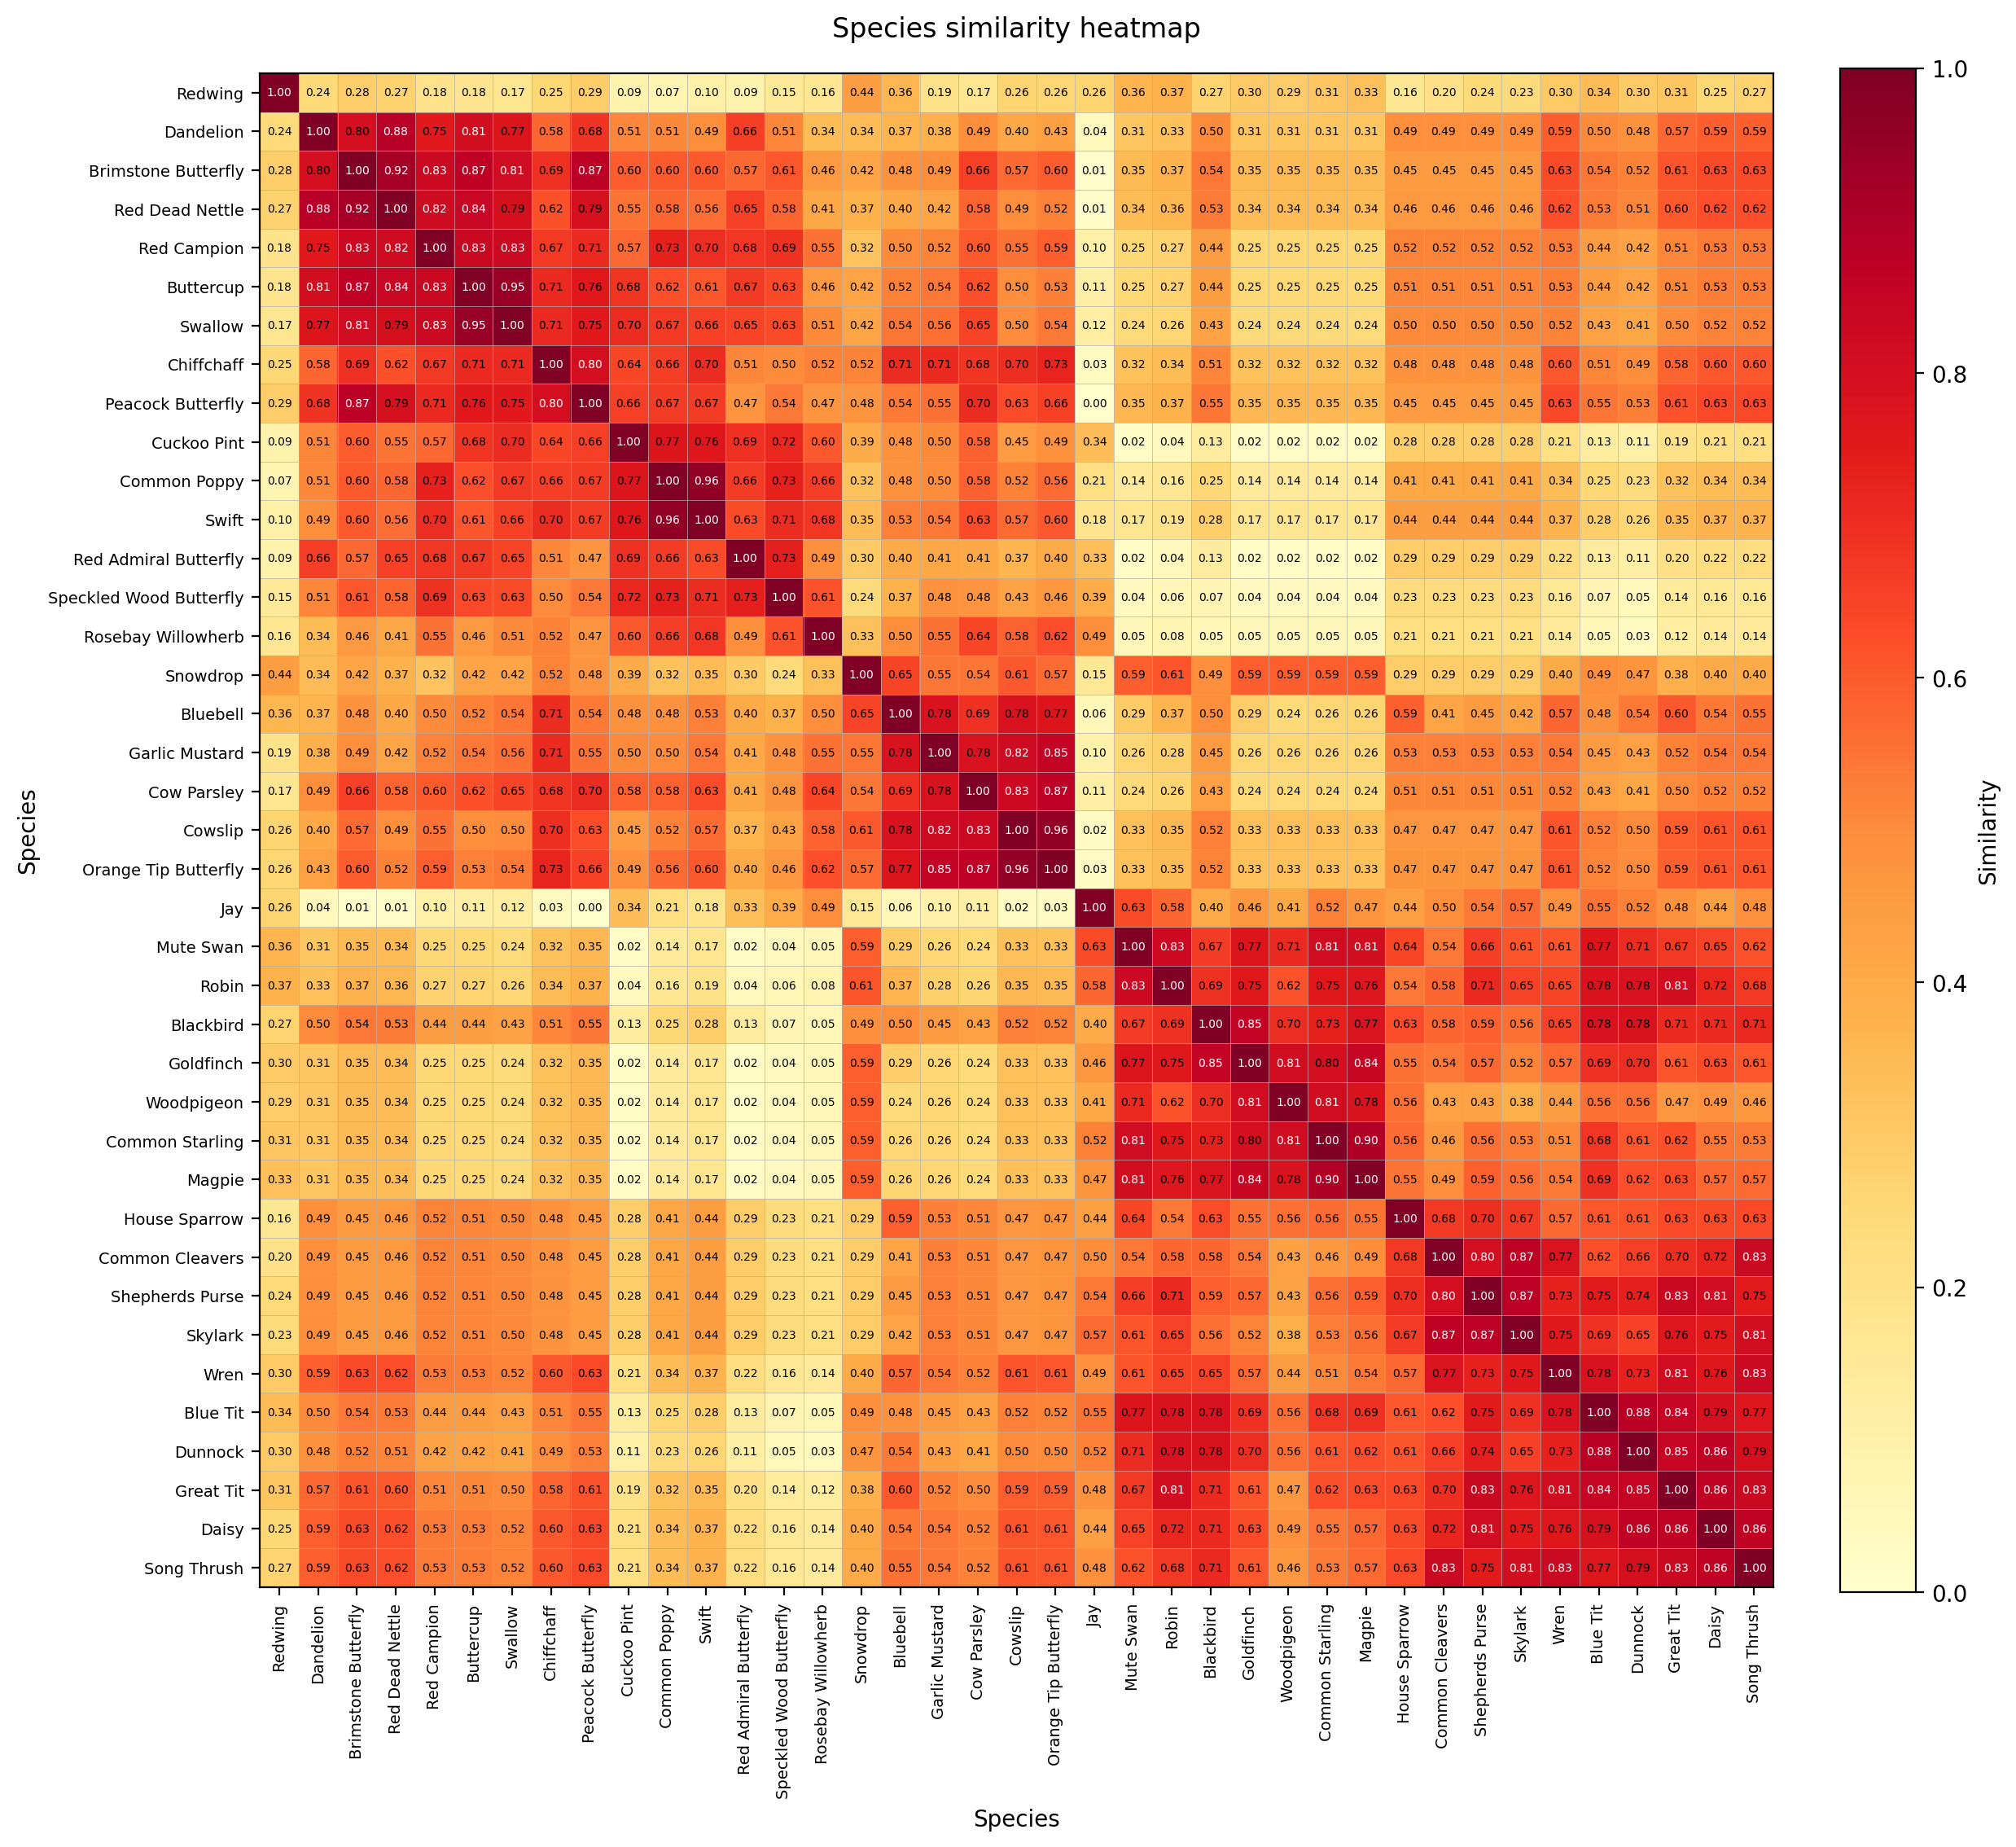
In the heatmap, species are ordered according to hierarchical clustering, causing similar seasonal structures to group together visually. Darker regions indicate stronger similarity within seasonal ecological space.
The same similarity structure can also be represented as a dendrogram:
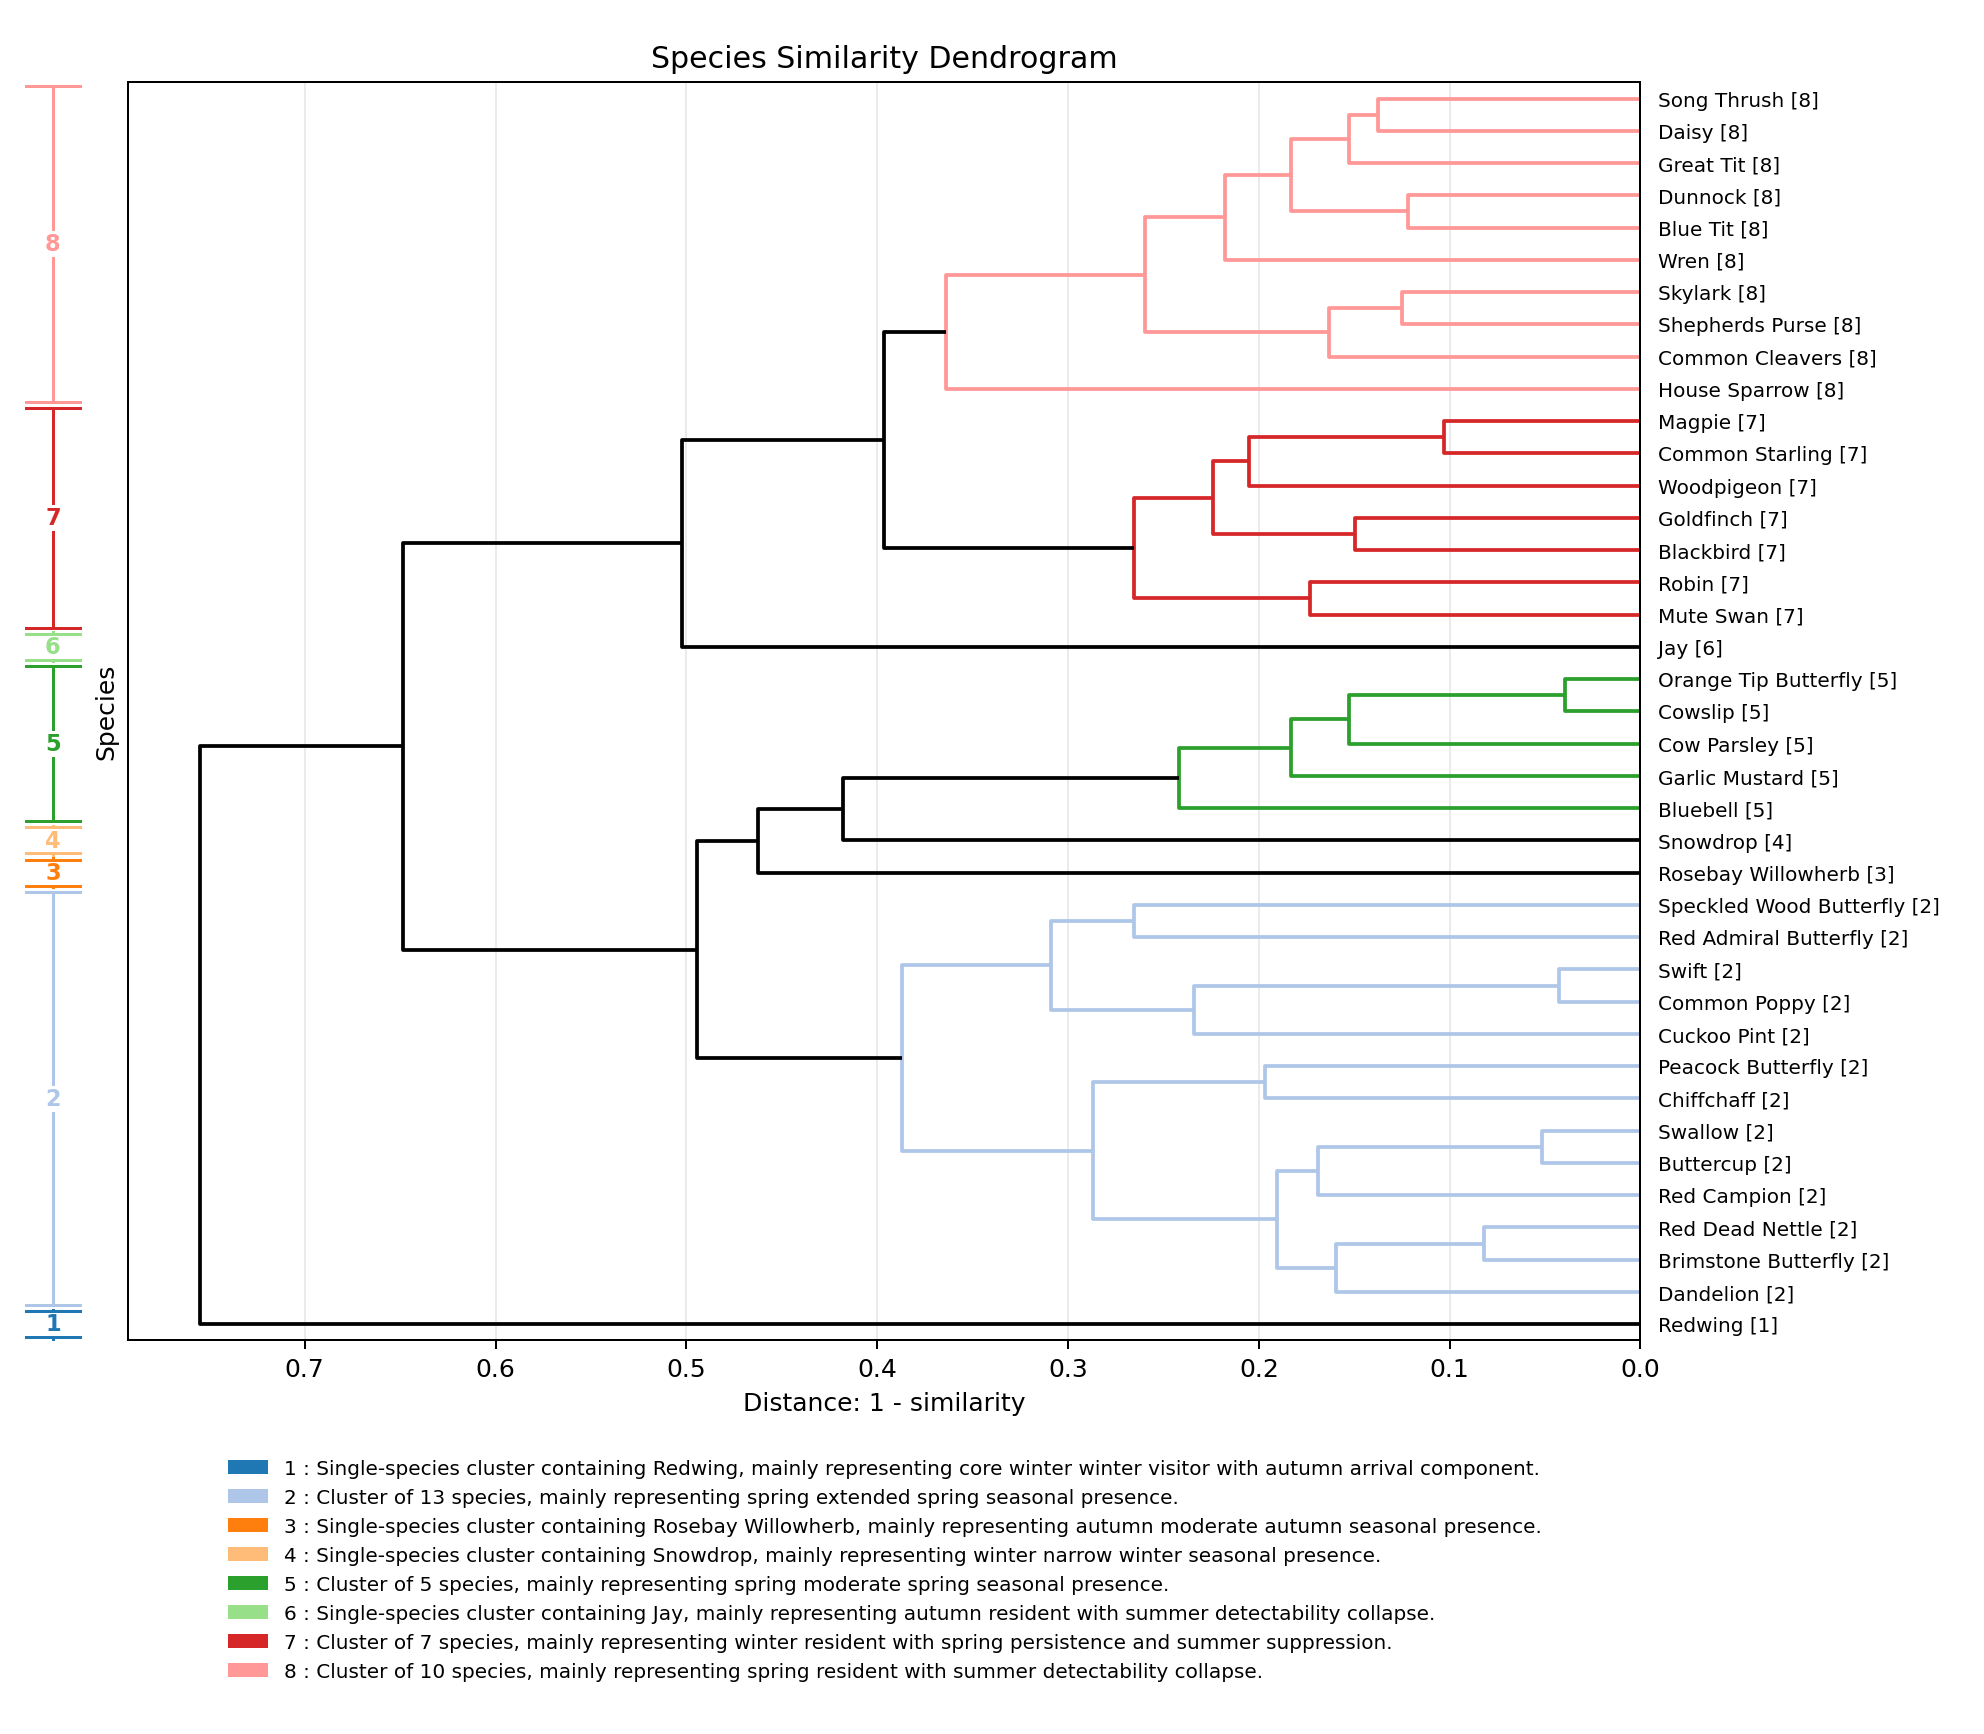
The dendrogram exposes nested neighbourhood structure within the seasonal ecological system. Species joined by short branch distances share more similar seasonal behaviour, while larger branch separations indicate increasingly distinct ecological timing and structure.
These neighbourhoods should be interpreted as exploratory seasonal assemblages rather than strict ecological or taxonomic categories. They provide a way of examining how seasonal activity is organised across the ecological year, exposing recurring timing structures, overlapping seasonal regimes, and broader phenological organisation within the observed system.
Tool
ODE Solver
A simple tool for exploring time-based models
The seasonal presence and detectability models were developed using a small, general-purpose ordinary differential equation solver, designed for experimentation and visualisation.
It allows simple systems to be defined and explored over time, making it possible to test how patterns might arise from underlying processes.
The application, the models, and instructions on how to run them are provided in the GitHub repository.