
Bat Call Analysis
The process presented in this section explores the structure of bat echolocation recordings through spectrogram inspection and pulse-level measurement.
Recordings are collected using handheld bat detectors in a range of local environments, including gardens, water margins, woodland edges, and open spaces. Both time-expansion and heterodyne recordings are included.
Rather than attempting automatic species identification alone, the work focuses on the internal structure of calls and passes — the timing, spacing, and organisation of pulses, and the behavioural patterns these may reveal.
A bat pass is not simply a sequence of sounds. Within a recording, pulses accelerate and decelerate, feeding buzzes emerge, and distinct phases of behaviour appear. Search, approach, buzz, and exit phases can often be recognised from timing structure alone.
The Spectrogram Viewer and analysis tools developed for this work provide a way of examining these recordings in detail.
Recordings are processed through the audio processing and analysis pipeline, producing structured outputs including pulse measurements, behavioural segmentation, plots, and exported JSON data suitable for further analysis in notebooks and downstream workflows.
The workflow is illustrated below:
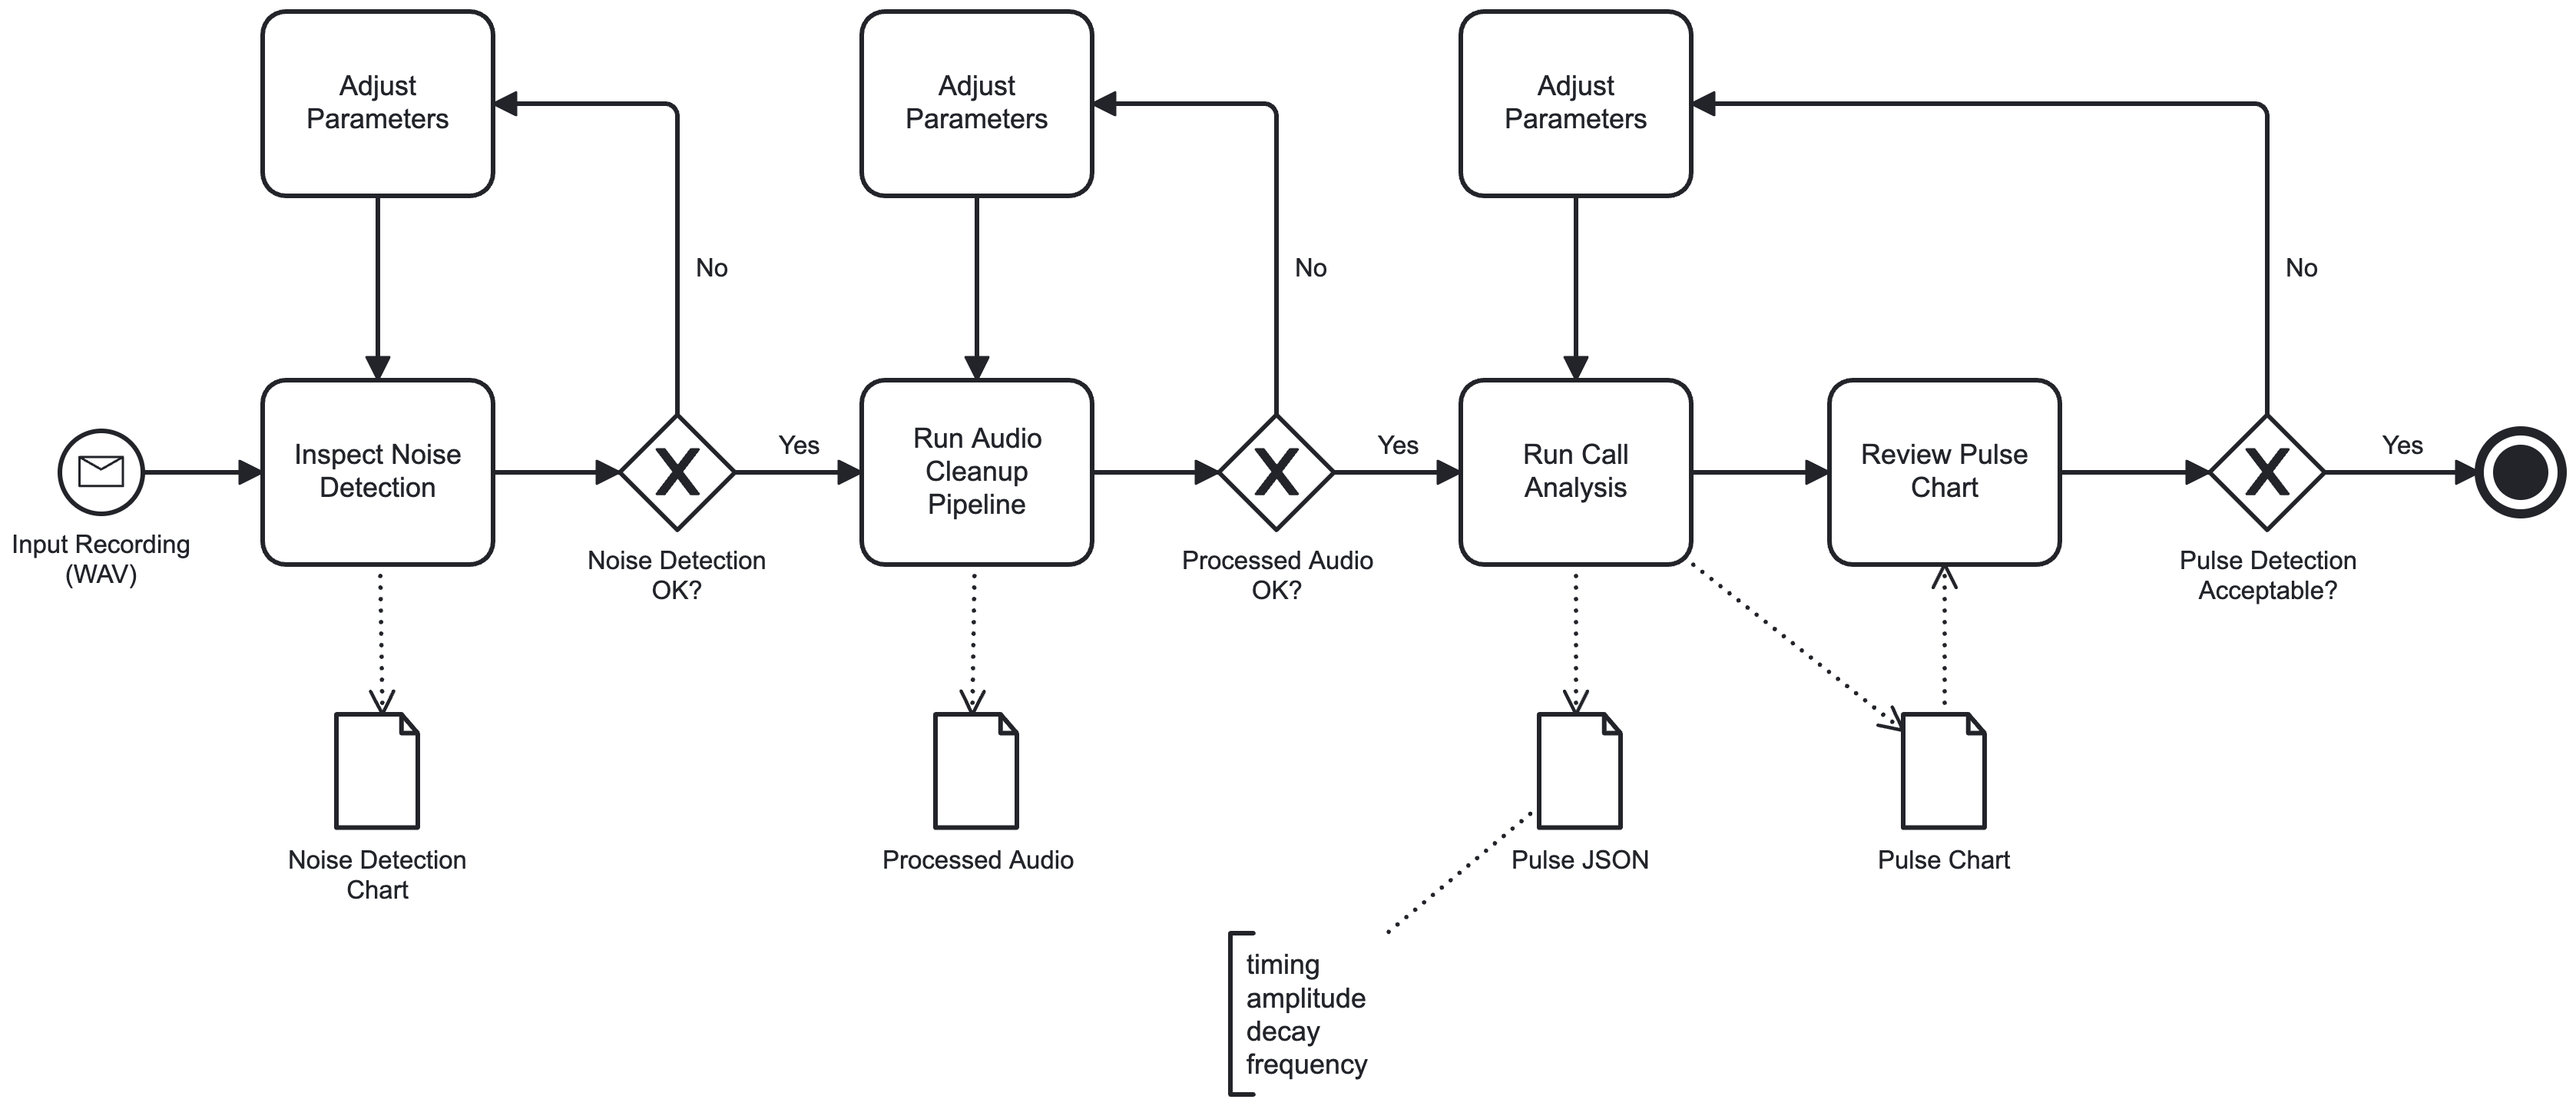
The pipeline produces pulse-level measurements describing features that allow recordings to be examined not only as audio, but as structured behavioural traces.
Particular attention is given to temporal organisation within recordings. An important theme emerging from the work is that pulse timing distributions themselves contain ecological and behavioural structure, even in recordings where frequency information is limited.
Contents
| Title | Description |
|---|---|
| Audio Processing Pipeline | Overview of the processing stages used to prepare bat recordings for spectrogram inspection and pulse-level analysis |
| Noise Detection | Identifying likely background-noise regions automatically using amplitude and spectral-energy characteristics |
| Noise Reduction | Reducing steady broadband noise through spectral subtraction while preserving pulse structure and timing |
| High-Pass Filtering | Suppressing low-frequency rumble and handling noise to emphasise the frequency range occupied by bat calls |
| Audio Normalisation | Scaling recordings to a consistent peak level while preserving the relative dynamics of pulse sequences |
| Call Analysis | Examining pulse timing, behavioural phases, and feeding-buzz structure within bat echolocation recordings |
Tool
Spectrogram Viewer
A tool for exploring bat recordings through spectrograms and pulse-level analysis
The analyses presented in this section were developed using the Spectrogram Viewer, a command-line application designed for examining bat echolocation recordings.
The tool combines waveform and spectrogram visualisation with noise reduction, pulse detection, and behavioural call analysis, allowing recordings to be explored in detail.
Structured outputs, including pulse measurements and JSON analysis files, can be exported for downstream analysis and notebook-based workflows.
The application, example workflows, and instructions on how to run it are provided in the GitHub repository.