
Call Analysis
The analysis stage is designed to identify individual bat pulses in a recording and extract simple measurements describing their timing and structure.
This is intended as a practical, repeatable way to turn recordings into structured data for further exploration, rather than a formal classification system.
Two analysis modes are currently supported:
- Time-expansion recordings, where both timing and frequency content can be analysed
- Heterodyne recordings, where only time structure is reliable
Both modes preserve pulse timing and behavioural structure, but only time-expansion recordings retain reliable frequency and amplitude information. Heterodyne recordings therefore support temporal and behavioural analysis, while spectral measurements must be treated cautiously or omitted entirely.
Overview
For suitable recordings (particularly cleaned time-expansion recordings), the analysis works in the following stages:
| # | Summary | Description |
|---|---|---|
| 1 | Detect pulse regions | The waveform is analysed to identify individual call pulses based on amplitude over time |
| 2 | Identify feeding buzz | A cluster of closely spaced pulses at the end of a sequence is detected as a terminal feeding buzz |
| 3 | Extract pulse metrics | Each detected pulse is measured (timing, amplitude, decay shape, and frequency characteristics) |
| 4 | Output | Results are written as a JSON file alongside a waveform plot with detected regions highlighted |
The result is a structured description of each pulse in the recording, suitable for further analysis or visualisation.
Pulse Detection
The waveform is first converted into a smoothed amplitude envelope. This makes it easier to identify the overall shape of each call (a sharp attack followed by a decaying tail).
A dynamic threshold is then applied to this envelope to identify regions of activity:
- Thresholds are based on the noise floor and overall signal variation
- Short gaps within a pulse are bridged
- Very short regions are discarded
These steps produce a set of candidate pulse regions.
Each region is then refined so that it captures:
- The initial attack (onset of the call)
- The full decay tail (the “conical” shape typical of bat calls)
The aim is to preserve the natural structure of each pulse rather than to isolate only the loudest peak.
Feeding Buzz Detection
Bat calls often end in a feeding buzz — a rapid sequence of closely spaced pulses as the bat approaches prey.
The analysis identifies this by:
- Examining the timing between successive pulses (inter-pulse interval)
- Searching for a cluster of pulses with consistently short spacing
- Focusing on the final portion of the recording
Pulses within this cluster are marked as part of the terminal buzz.
Because these pulses are shorter and more densely packed than earlier calls, a second-pass peak detector is applied within the buzz region to recover pulses that may not have been fully captured by the main detector.
Pulse Measurements
For each detected pulse, a set of simple measurements is calculated.
Timing
- Start, peak, and end time within the recording
- Pulse duration
- Inter-pulse interval (IPI) to neighbouring pulses
For time-expansion recordings, these are also reported in estimated real time by applying the expansion factor.
Amplitude and Shape
- Peak amplitude
- RMS amplitude
- Attack duration (onset to peak)
- Decay duration (peak to end)
- Approximate decay slope
- Exponential decay fit (time constant and goodness of fit)
These describe the overall shape of the pulse in the time domain.
Frequency Content
A short-time Fourier transform (STFT) is applied within each pulse to estimate:
- Dominant (peak) frequency
- Spectral centroid (overall “centre of energy”)
- Bandwidth
- A simple frequency trace across the pulse (start, middle, end)
- Approximate frequency slope
For time-expansion recordings, these frequencies are scaled back to estimated real bat frequencies using the expansion factor.
Output
The analysis produces two outputs:
| Output | Description |
|---|---|
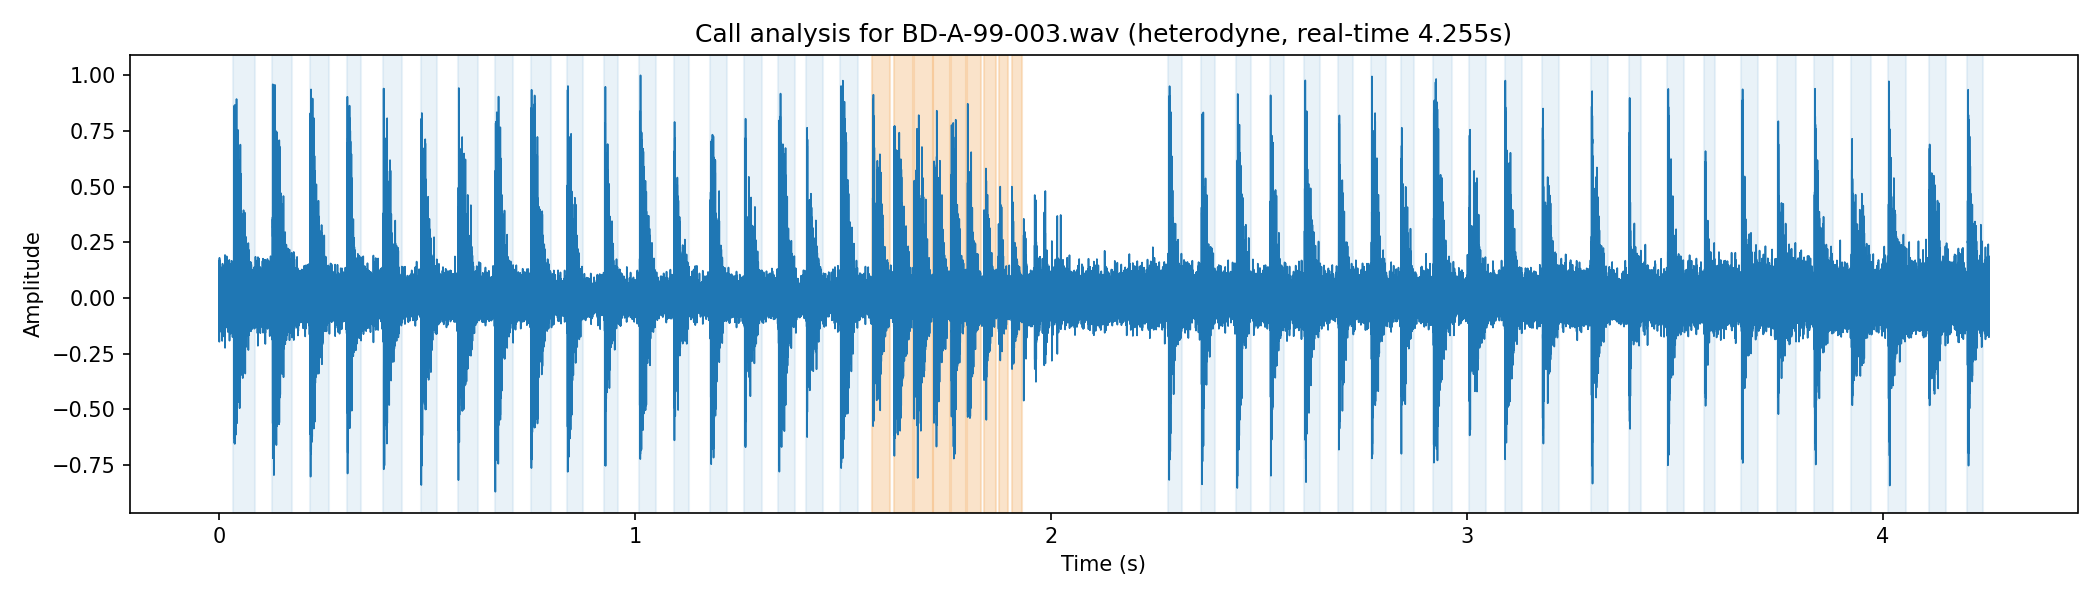
| Waveform plot | A waveform view with detected pulse regions shaded, making it easy to visually verify the detection |
| JSON file | A structured file containing one entry per detected pulse, including all measured properties |
This JSON output is intended as a starting point for:
- Exploratory analysis (e.g. plotting pulse timing or frequency trends)
- Comparing recordings
- Building simple call “signatures”
- Integrating into other workflows or reporting tools
An example waveform that has been passed through the call analysis is shown below, with the feeding buzz highlighted:
Tool
Spectrogram Viewer
A tool for exploring bat recordings through spectrograms and pulse-level analysis
The analyses presented in this section were developed using the Spectrogram Viewer, a command-line application designed for examining bat echolocation recordings.
The tool combines waveform and spectrogram visualisation with noise reduction, pulse detection, and behavioural call analysis, allowing recordings to be explored in detail.
Structured outputs, including pulse measurements and JSON analysis files, can be exported for downstream analysis and notebook-based workflows.
The application, example workflows, and instructions on how to run it are provided in the GitHub repository.