
Audio Normalisation
After filtering and noise reduction, the recording is normalised to a consistent peak level.
The purpose of this stage is not to alter the structure of the recording, but simply to scale the waveform so that quieter recordings are easier to inspect, visualise, and listen to.
Without normalisation, recordings captured under different conditions can vary substantially in amplitude. Some passes may appear extremely faint even when their internal pulse structure is clearly present.
Peak Normalisation
The pipeline uses peak normalisation.
The maximum absolute amplitude within the recording is identified, and the entire waveform is scaled relative to that peak so that it reaches a predefined target level.
Conceptually:
- The loudest point in the recording becomes the reference level
- All other samples are scaled proportionally
- Relative differences within the recording are preserved
This differs from dynamic compression, which actively changes the balance between loud and quiet parts of the signal.
Here, the internal dynamics of the recording remain intact.
Preserving Pulse Structure
Because the same scaling factor is applied to the entire waveform:
- Pulse timing is unchanged
- Relative pulse amplitudes are preserved
- Behavioural structure remains unaffected
This makes normalisation useful as a preparation step for later visualisation and analysis stages without altering the underlying organisation of the recording.
Purpose Within the Pipeline
Normalisation primarily improves usability and consistency.
It helps:
- Waveforms display more clearly
- Spectrogram contrast remain more consistent
- Quiet recordings become easier to inspect manually
- Playback levels remain manageable across recordings
The aim is not to make all recordings sound equally loud, but to place them onto a more comparable scale for exploration and analysis.
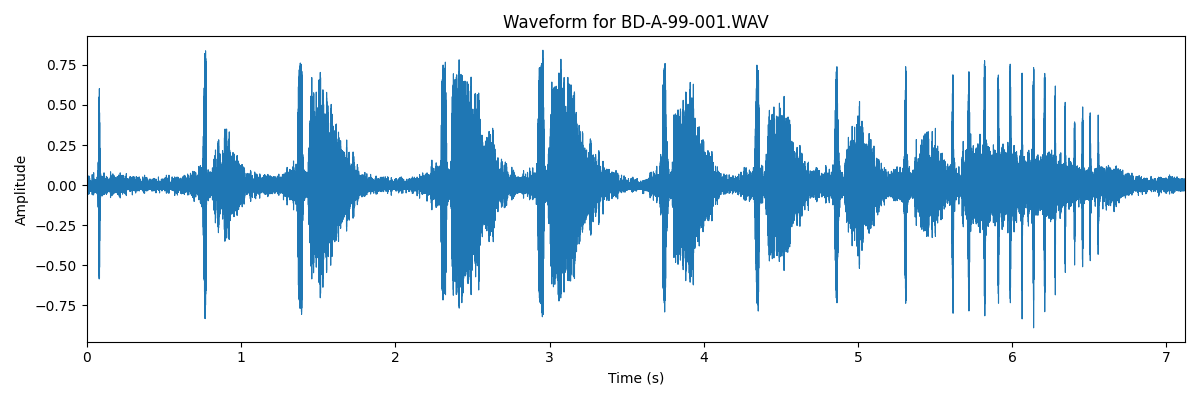
Results
An example waveform, that has been passed through the full audio pipeline is shown below:
Tool
Spectrogram Viewer
A tool for exploring bat recordings through spectrograms and pulse-level analysis
The analyses presented in this section were developed using the Spectrogram Viewer, a command-line application designed for examining bat echolocation recordings.
The tool combines waveform and spectrogram visualisation with noise reduction, pulse detection, and behavioural call analysis, allowing recordings to be explored in detail.
Structured outputs, including pulse measurements and JSON analysis files, can be exported for downstream analysis and notebook-based workflows.
The application, example workflows, and instructions on how to run it are provided in the GitHub repository.