
Noise Detection
To reduce background noise automatically, the pipeline includes a simple noise-region detection step. This replaces the manual process of selecting a “quiet” section of audio (as you might do in Audacity).
Region Detection
The recording is divided into short, overlapping windows (typically 50 ms). For each window, two measurements are taken:
- Loudness (RMS amplitude) → Quieter windows are more likely to contain background noise only.
- Band energy ratio → The fraction of spectral energy within the expected signal band (for bat recordings, typically ~3.5–6.5 kHz after time expansion).
The band energy ratio is then used to identify the type of signal in the window:
- Low ratio → broadband noise / hiss
- High ratio → structured signal (e.g. bat calls)
A window is considered likely noise if it is both:
- Relatively quiet compared to the rest of the recording, and
- Relatively low in energy within the target band
Thresholds are determined using percentiles, so the detection adapts to each recording rather than relying on fixed values.
From Windows to Regions
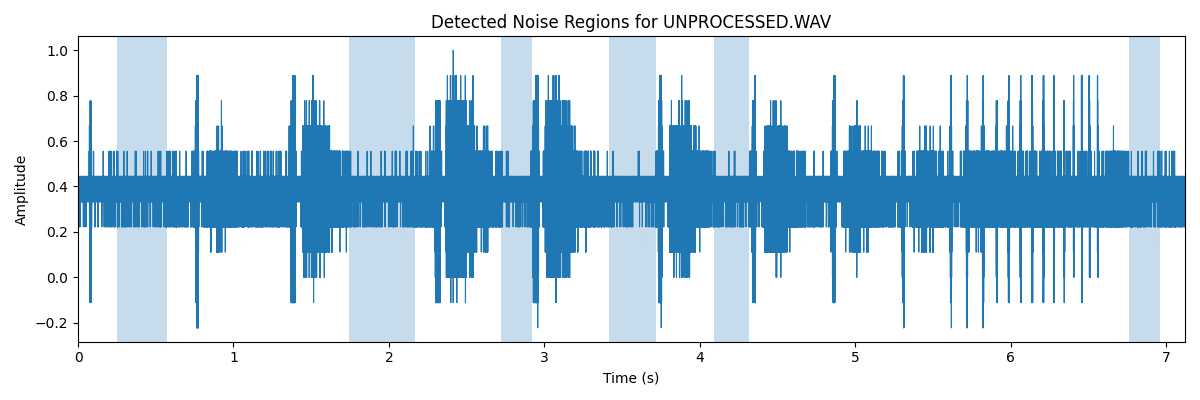
Neighbouring “noise” windows are merged into longer regions, and only regions above a minimum duration are kept. These regions are then used as the noise profile for subsequent noise reduction. An example waveform, with noise regions highlighted, is shown below:
Tool
Spectrogram Viewer
A tool for exploring bat recordings through spectrograms and pulse-level analysis
The analyses presented in this section were developed using the Spectrogram Viewer, a command-line application designed for examining bat echolocation recordings.
The tool combines waveform and spectrogram visualisation with noise reduction, pulse detection, and behavioural call analysis, allowing recordings to be explored in detail.
Structured outputs, including pulse measurements and JSON analysis files, can be exported for downstream analysis and notebook-based workflows.
The application, example workflows, and instructions on how to run it are provided in the GitHub repository.