
Bat Call Timing Analysis
The Bat Call Timing Analysis tools are compact handheld utilities designed for exploring the temporal structure of bat echolocation sequences.
The system forms part of the wider Bat Call Analysis work developed for Field Notes Journal, but has also been adapted for constrained handheld systems including the TI-84 Plus CE-T Python calculator as part of the Pocket Ecology project.
The handheld implementation focuses specifically on pulse timing structure rather than full acoustic or spectrogram analysis.
The calculator tools operate on timing data extracted from the JSON analysis files generated by the desktop Spectrogram Viewer software.
These exported datasets contain pulse-level timing measurements including:
- Pulse timing
- Inter-pulse intervals (IPI)
- Pulse repetition intervals (PRI)
- Timing deltas
- Sequence timing structure
The handheld tools then analyse these measurements directly on-device.
Concept
Bat echolocation recordings contain substantial structural information within their timing behaviour alone.
As bats move through different flight and hunting behaviours, pulse timing changes systematically:
- Pulse intervals compress
- Repetition rates accelerate
- Sequence structure evolves dynamically through time
The Pocket Ecology timing tools explore whether meaningful acoustic structure can be examined using compact numerical systems running on highly constrained handheld hardware.
Rather than processing full spectrograms, the system instead focuses on:
- Timing relationships
- Pulse spacing
- PRI compression
- Sequence acceleration
- Temporal pattern structure
Pulse Timing Metrics
The handheld implementation analyses several core timing measures derived from detected pulse sequences.
Pulse Repetition Interval (PRI)
The time between successive detected pulses. PRI structure forms one of the primary indicators of changing echolocation behaviour and sequence dynamics.
Inter-Pulse Interval (IPI)
Measures the spacing between pulses within a sequence. Changes in IPI often reveal:
- Acceleration
- Compression
- Relaxation behaviour
within the overall call structure.
Timing Delta Analysis
The system also analyses changes in timing behaviour between successive intervals. This allows the handheld tools to examine:
- Acceleration trends
- Stability regions
- Rapid timing transitions
within bat call sequences.
Sequence Structure
The timing-analysis tools are designed to work with complete pulse sequences exported from the desktop analysis environment.
The handheld implementation can therefore examine:
- Overall sequence timing shape
- Local compression regions
- Timing minima
- Recovery regions
- Sequence-level temporal organisation
One of the more interesting aspects of the project is that substantial structural information often remains visible even when frequency-domain detail is absent.
This proved particularly useful when working with:
- Heterodyne recordings
- Highly constrained computational environments
Example : Pipistrelle Time-Expansion Recording
The examples below show pulse timing metrics extracted from a time-expansion recording of a pipistrelle bat sequence.
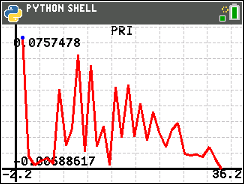
This particular sequence is known to contain an approach phase followed by a terminal feeding buzz and to end after the buzz.
Several aspects of the sequence structure become visible in the resulting charts.
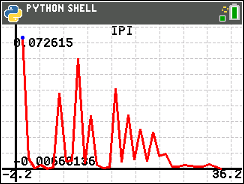
PRI and IPI Structure
The sharp decline at the beginning of the PRI and IPI plots shows rapid interval compression associated with the transition from approach behaviour into the terminal feeding buzz.
As the sequence progresses, pulse spacing collapses further into the dense high-rate structure visible near the end of the recording.
Even without viewing the original spectrogram, the overall behavioural transition remains recognisable within the timing architecture alone.
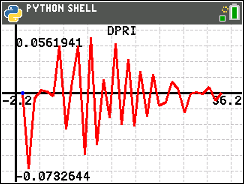
Delta PRI (DPRI)
Unlike PRI and IPI, which show interval size directly, the DPRI plot oscillates around zero because it represents the change in interval timing between successive pulses.
Large negative excursions therefore correspond to rapid pulse compression during the approach-to-buzz transition, while oscillation within the sequence reflects rapidly changing repetition structure as the bat closes on its target.
Large oscillations within the DPRI structure indicate:
- Rapid timing acceleration
- Local timing instability
- Abrupt changes in repetition rate
associated with active prey-interception behaviour.
In many cases, the DPRI structure reveals behavioural transition dynamics more clearly than the raw PRI values themselves.
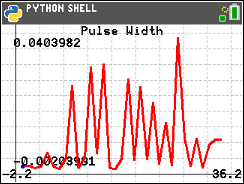
Pulse Width
The pulse-width plot shows substantial variation in detected pulse duration throughout the sequence.
Changes in width frequently accompany changes in echolocation behaviour and provide additional contextual information alongside the interval structure.
Although the Pocket Ecology tools focus primarily on timing behaviour rather than full acoustic reconstruction, the combined timing metrics still preserve a surprising amount of behavioural organisation.
Pocket Ecology
The handheld timing-analysis tools are intended as companions to the desktop Spectrogram Viewer environment rather than replacements for it.
The desktop system performs:
- Spectrogram generation
- Pulse detection
- Acoustic measurement
- JSON export
The Pocket Ecology tools instead represent an experiment in portable ecological computation:
How much useful temporal structure can be analysed once the extracted timing information is transferred onto extremely small portable hardware
Repository
TI-84 Python
Small scientific and modelling experiments for the TI-84 Plus CE-T Python
As a slightly improbable side project, a growing collection of numerical, modelling, and scientific computing experiments have gradually been implemented on the TI-84 Plus CE-T Python calculator.
The repository explores what can realistically be achieved within the calculator's highly constrained Python environment, including ODE solving, ecological modelling, graphical rendering, and various optimisation techniques required to make small scientific applications run on limited handheld hardware.